-
News | Real Estate
Dubai’s Commercial Property Market in 2025: What Drove the $37 Billion Record and Why It Matters
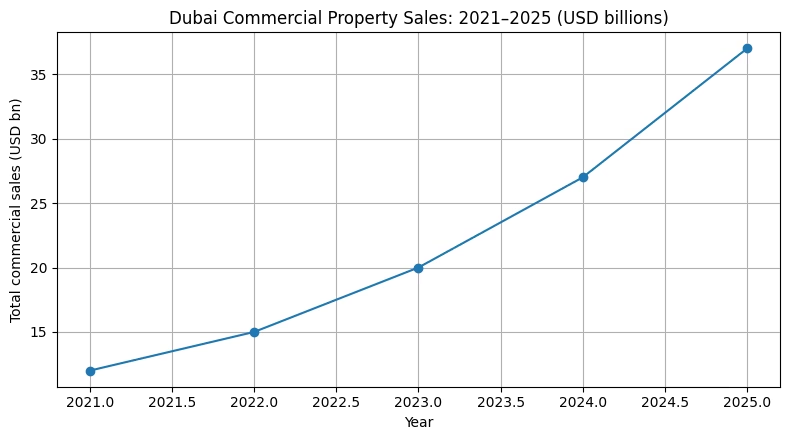
Dubai’s commercial property market closed 2025 at a historic high, reaching $37 billion in total sales. The number is important, but the reason behind it matters more. This was not a short-term surge driven by speculation. It was the result of larger deal sizes, the return of institutional capital, and growing confidence in income-producing assets across offices, retail, and mixed-use districts.
Investors were clear about their intent. They understood what they were buying, how those assets would perform, and why Dubai fit into their long-term allocation plans.
The Headline Number and Why It Matters
Market trackers and industry reports confirm that commercial property transactions in Dubai reached $37 billion in 2025, the highest level ever recorded. This marks a clear step up from previous years and signals a market that has moved into a more mature phase.
The figure matters for three reasons. First, it shows scale. The market crossed a level that points to depth rather than recovery. Second, it shows deal quality. High-value transactions made up a large share of activity, pushing totals higher even without a sharp rise in deal count. Third, it shows who was buying. Institutional investors played a central role, shaping pricing and asset selection.
According to the annual commercial report from CRC Property, total transaction value in local currency reached about AED 136 billion. This was paired with higher transaction volumes, showing growth through both deal size and wider participation.
What Drove the Record Total in 2025
Institutional Capital and Larger Transactions
Sovereign funds, private equity firms, and REIT platforms increased their exposure to Dubai commercial property during 2025. These investors focus on scale, predictable income, and clear exit options. Prime locations and stable leasing profiles helped close several large transactions.
When a small number of large institutional deals take place, total market volume can rise quickly. This effect was visible across the year, especially in office and mixed-use assets.
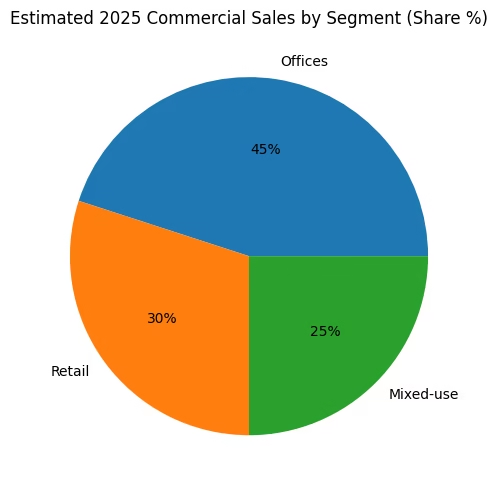
Estimated 2025 Segment Breakdown (Offices, Retail, Mixed-use)
Office Market Recovery and Changing Demand
Office leasing and acquisitions strengthened steadily through 2025. Demand was highest for compact and flexible offices in established and master-planned districts. Tenants showed a clear preference for spaces that are easy to access, ready to use, and close to residential areas.
CRC’s quarterly updates showed offices among the fastest-growing commercial segments. This reflects a wider global shift toward high-quality office stock that supports hybrid work and long-term business use.
Retail and Mixed-Use Assets Regaining Strength
Retail activity improved as tourism and consumer spending recovered. Prime retail locations saw faster leasing, while secondary areas recovered at a slower pace.
Mixed-use developments also gained attention. By combining offices, retail, and residential uses, these assets offer multiple income sources. This reduces reliance on a single tenant type and supports more stable occupancy over time.
Key Data Signals From 2025
Total commercial sales reached $37.0 billion, setting a new record. CRC’s full-year data pointed to commercial transaction value of around AED 136 billion, with strong year-on-year growth in both value and volume.
Transaction counts rose into the tens of thousands, depending on the source. While exact figures differ, the shared signal was broader participation across asset types and investor profiles.
Where office, retail, and mixed-use shares are discussed, they are based on CRC trends combined with conservative estimates to support practical analysis.
Dubai Commercial Sales Trend (2021-2025)
How the Market Split by Segment
Offices made up the largest share of commercial transaction value in 2025. Based on CRC signals, offices accounted for roughly 40 to 50 percent of total value. Institutional buying and demand for high-quality small to mid-size offices supported this share.
Retail assets represented an estimated 25 to 35 percent of activity. As travel and spending improved, investors returned to well-located retail in active districts.
Mixed-use assets accounted for around 20 to 30 percent of total value. These properties appealed to investors looking for diversified income and steady daily demand.
Who the Buyers Were
The buyer base in 2025 leaned strongly toward institutional and large-scale investors. Sovereign and government-linked funds increased regional exposure. Global private equity groups acquired single assets and portfolios. Regional and ultra-high-net-worth investors also expanded their commercial holdings for income and diversification.
These buyers tend to be disciplined. They prefer assets that can produce stable income or support leasing improvements over time.
What Rents, Yields, and Leasing Activity Showed
Office leasing gathered pace through the year, especially in core business districts and integrated office clusters. By the second half of 2025, landlords in prime locations had more leverage during lease renewals, particularly for fitted and flexible spaces.
Retail rents improved as footfall increased. Prime retail areas outperformed secondary locations, showing that demand was selective rather than broad-based.
Yields for core, income-producing assets tightened as institutional demand increased. Secondary assets continued to offer higher starting yields, attracting investors willing to take on leasing or repositioning risk. This yield compression was seen as a sign of confidence, but it also raised questions about pricing discipline.
How 2025 Changed the Investment Case
One clear outcome was lower vacancy risk for integrated assets. Offices and mixed-use properties with a nearby residential base were less dependent on city-wide commuting patterns.
Average deal sizes increased. This improved liquidity for sellers but raised entry thresholds for new buyers. Active asset management became more important, with investors placing value on fit-outs, service upgrades, and leasing strategies that support rent growth.
Location also mattered more. Prime districts such as DIFC, Business Bay, JLT, and Dubai Marina attracted a large share of institutional capital. Infrastructure expansion in and around these areas continues to shape future demand.
Risks to Watch in 2026
The supply pipeline is a key factor. New office and mixed-use completions expected through 2026 could slow rental growth if absorption weakens. Pre-leasing levels will be important to track.
Pricing versus fundamentals is another concern. Strong institutional demand can push values ahead of leasing reality. Yield spreads will need close monitoring.
External risks also remain. Global interest rates, tourism trends, and geopolitical events can influence cross-border investment flows.
Practical Implications for Investors and Occupiers
Investors focused on income stability are likely to continue favouring core commercial assets in prime districts with long-term tenants. Buying patterns in 2025 support this view.
Value-focused investors may find opportunities in secondary or transitional assets where leasing improvements and repositioning can support yield compression and capital growth.
For occupiers, flexible office space in mixed-use or master-planned districts offers clear benefits. Proximity to residential areas reduces commute friction and supports staff retention.
Closing Perspective
Dubai’s $37 billion commercial property year was not accidental. It reflected clear strategy, deeper institutional involvement, and a market driven by daily use rather than speculation. As the city moves into 2026, understanding how each asset works within its district will remain critical for sound investment and occupancy decisions.